
The business
Reports.
Getting the
numbers out.
Eight tabs, five date ranges, a location filter and a CSV button. This page tells you which tab answers which question, and the two limits worth knowing before you ask for a year of data.
Which tab answers which question
Eight tabs. Most people only ever use three of them, so here is what each one is actually for.
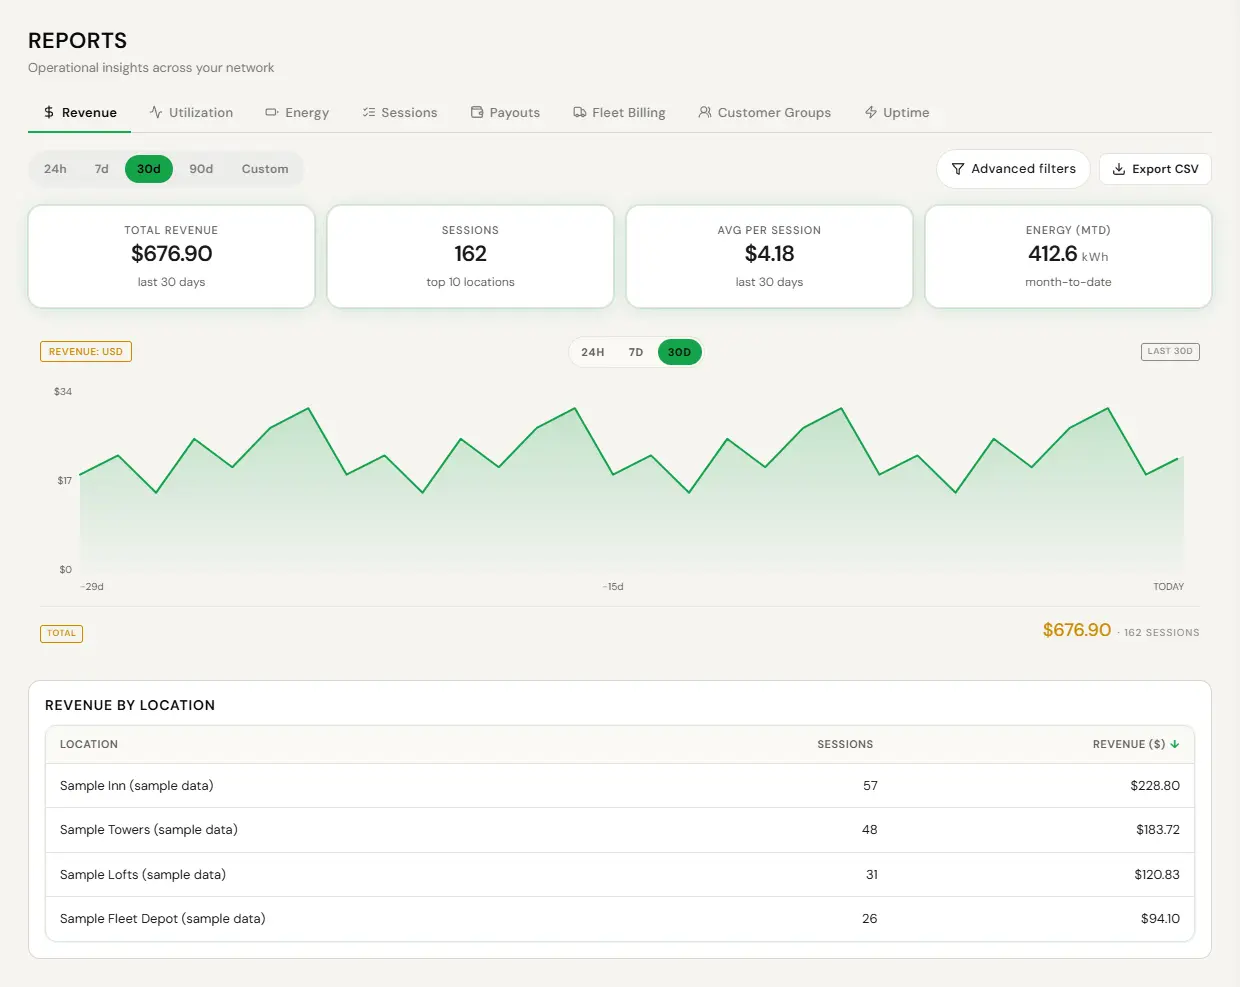
| Tab | The question it answers |
|---|---|
| Revenue | What came in, by site and by period. The tab an owner or a board wants. |
| Utilization | Which chargers are earning and which are ornaments. The tab that tells you where to put the next unit. |
| Energy | Kilowatt-hours delivered. The tab a rebate program, a utility or a sustainability report asks for. |
| Sessions | The transaction log. Every session, what it delivered, what it cost and when. The tab you use when one driver is disputing one charge. |
| Payouts | What has been paid to you and what is still pending. Check it weekly. |
| Fleet Billing | What fleet accounts were billed. Only relevant if you run fleets. |
| Customer Groups | Usage broken out by the driver groups you have defined. |
| Uptime | How much of the period each charger spent reachable. |
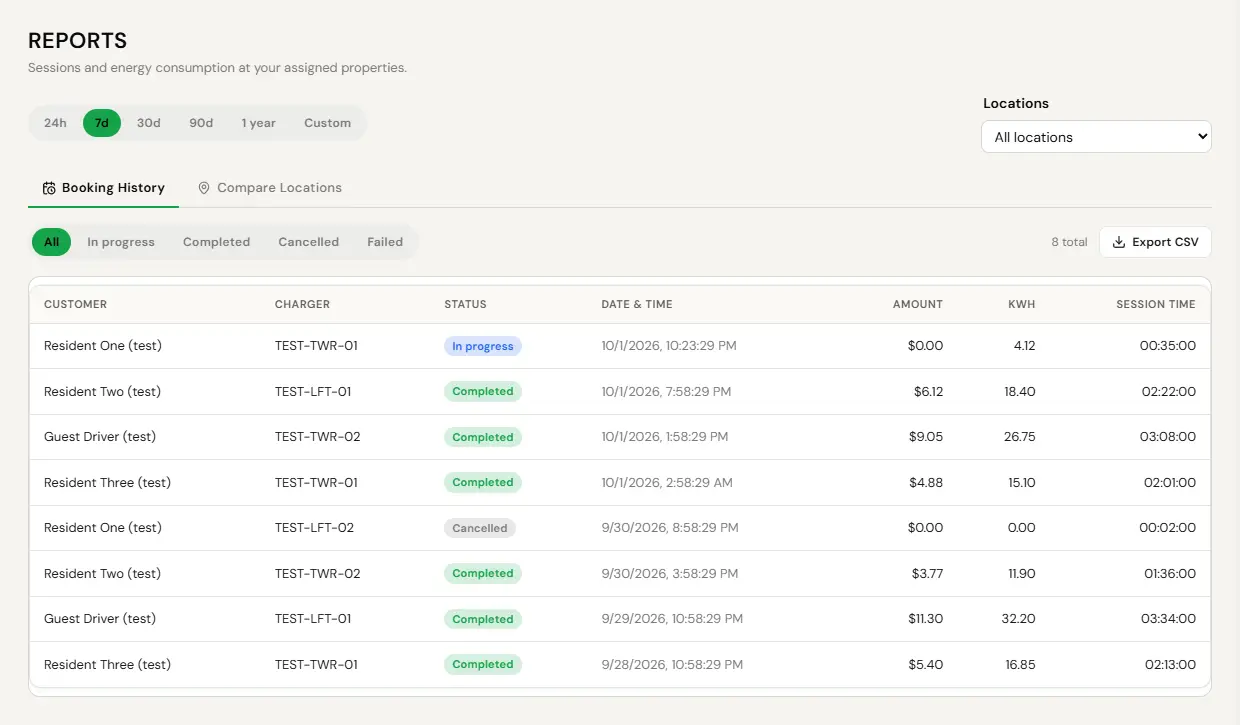
A Sales Partner sees Sessions, Energy, Utilization and Payouts, with no Revenue tab, and does not see Fleet Billing or Customer Groups. Commission has its own Commissions page. A Building Admin sees booking history and a Compare Locations tab of units consumed per location. A Viewer sees the reports and can change nothing.
Filtering
- Open Reports and pick a tab.
- Set the date range: 24 hours, 7 days, 30 days, 90 days, or a custom range.
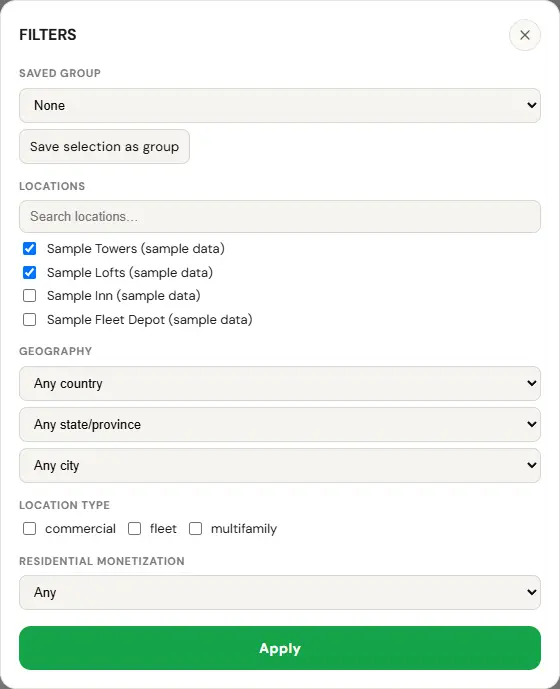
- Open Advanced filters and tick the locations you want, or pick a saved group.
- Read the numbers, or export them.
Advanced filters on the reports page take any number of locations at once, and a selection can be saved as a named site group and reused. You can also narrow by country, state or city, by site type, and by whether a site is enrolled in residential hosting. Every tab and every export honours the same selection, so set it once.
There is also no per-charger report filter. To look at one charger, open the charger itself, where its own sessions and message history live.
Exporting
- Set the range and the location filter first. The export honours them.
- Export the tab to CSV.
- Open it in Excel or Google Sheets.
Each tab exports itself. There is no single button that exports all eight at once.
CSV is deliberate. It opens everywhere, it does not carry formatting that breaks in someone else’s version of Excel, and an accountant, a funder or a rebate program will take it without argument. If you need a formatted document, format the CSV. Your data is yours and all of it is exportable.
Two limits
- 365 days. A report range cannot exceed a year. For a two-year comparison, run it twice.
- 10,000 rows. A CSV export stops there. If your file looks short, that is why. Narrow the range and export in parts.
Neither is arbitrary. Both are what keeps a report that covers a hundred chargers from timing out on somebody else’s screen.
Or just ask
Most report questions are faster asked than clicked, because you usually want one number rather than a table.
Everything on this page has a spoken equivalent, and EVII answers inside your own boundary. She cannot see a site you do not hold, and no phrasing widens that.