📊 Projected EV Charging Revenue – Mission Hills EV Initiative Site
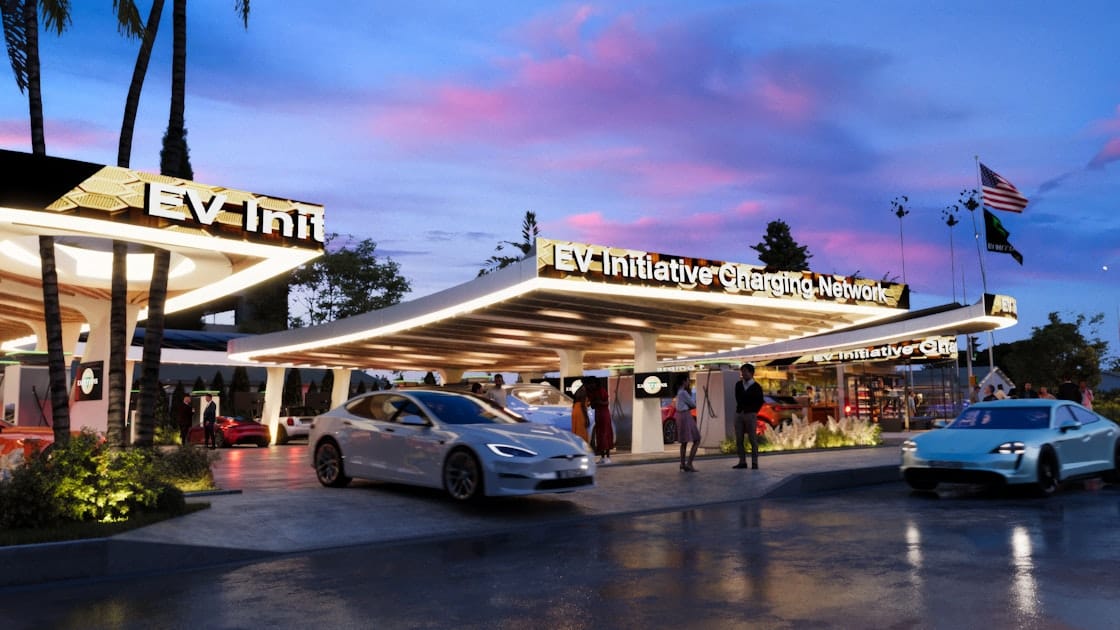
Here’s a realistic look at what our upcoming EV charging hub at 15555 San Fernando Mission Blvd., Los Angeles, can achieve in terms of utilization and revenue—just from charging sessions alone!
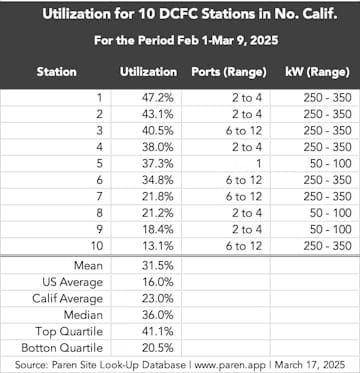
Revenue projections for your 10 dual-port 400kW DCFCs (serving 20 stalls) at EVII Mission Hills using both the median (36%) and top quartile (41.1%) utilization rates from NorCal. This will include daily, weekly, monthly, and annual earnings per charger and for the full site — based solely on EV charging at $0.48/kWh.
- Location: 15555 San Fernando Mission Blvd, Los Angeles, CA (Mission Hills)
- Charging Setup: 10 dual-plug DC fast chargers (20 stalls total), 400 kW each, operating 24/7
- Charging Price: $0.48 per kWh (consistent with typical fast-charging rates in CA (How Much Does It Cost to Charge an Electric Car? | Edmunds))
Utilization Sce****narios: We analyze two utilization levels based on a Northern California fast-charger study (Paren | Benchmarking DC Fast Charging Station Utilization Against Neighboring Sites): a median scenario (36% utilization) and a high-use scenario (41.1% utilization). In this context, “X% utilization” means each charger is delivering power X% of the time (24/7) – roughly equivalent to being at full 400 kW output for that fraction of the day. (For example, 36% utilization ≈ each charger active ~8.6 hours per 24-hour day, and 41.1% ≈ ~9.9 hours per day.) We use these rates to project energy dispensed and revenue earned, assuming continuous demand to meet the utilization level.
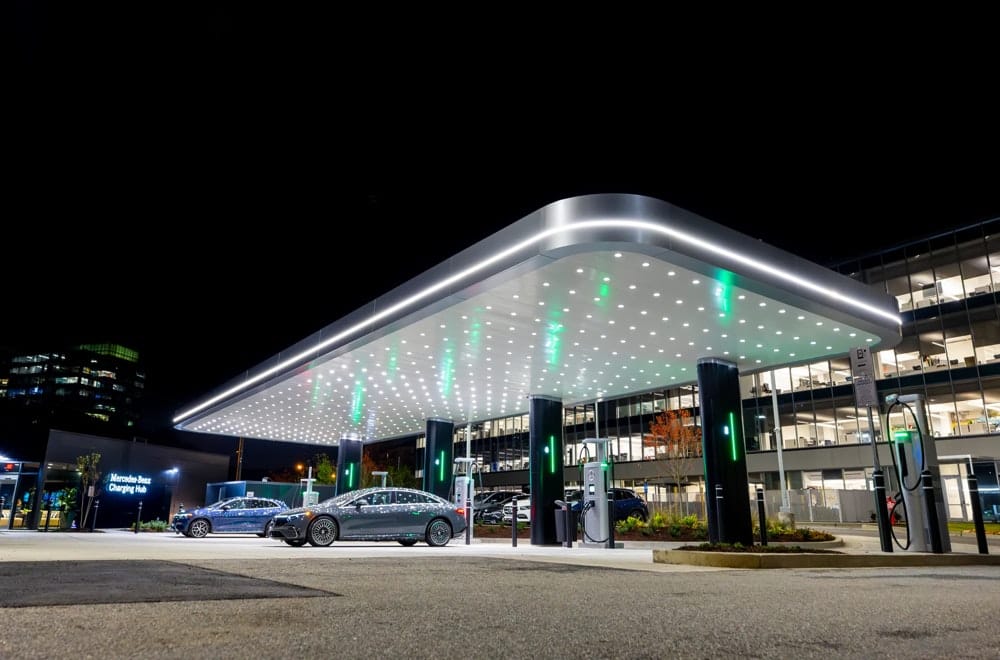
(Mercedes-Benz opens its first 400kW EV charging station in the US | The Verge) A high-power EV charging hub (illustrative example) with multiple 400 kW fast chargers. Each charger typically serves two stalls, similar to the planned Mission Hills setup. Such ultra-fast chargers allow drivers to recharge quickly, and high utilization of these chargers can generate substantial revenue for the operator.
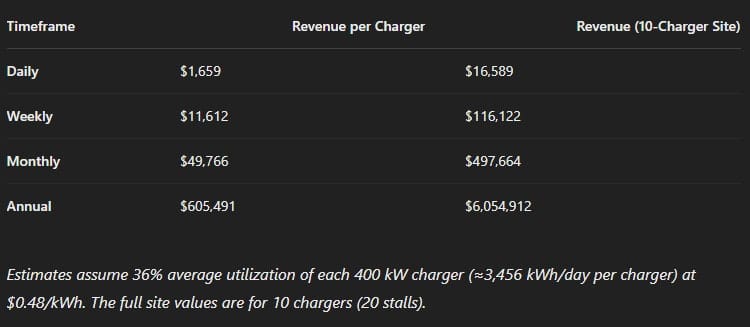
Scenario 1: Median Utilization (36%)
In the median utilization scenario, each charger operates at ~36% of its capacity on average (this was the median usage observed in a sample of NorCal fast-charge stations (Paren | Benchmarking DC Fast Charging Station Utilization Against Neighboring Sites)). This means each 400 kW charger delivers about 3,456 kWh per day (0.36 × 400 kW × 24 h). At a rate of $0.48 per kWh, that usage translates to roughly $1,659 in revenue per charger per day. The table below details the estimated earnings per charger and for the full 10-charger site:
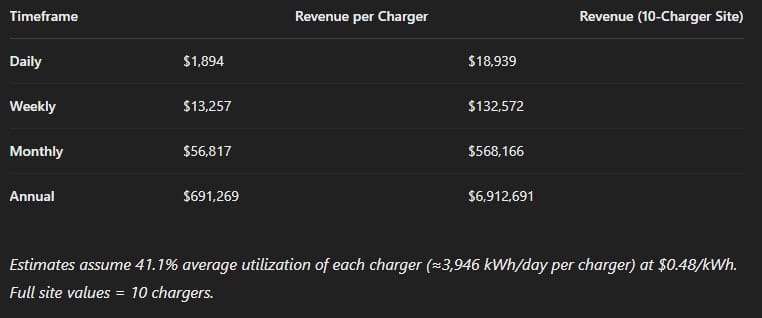
Scenario 2: Top Quartile Utilization (41.1%)
In the top-quartile utilization scenario, each charger is busier – ~41.1% utilized on average (a level achieved by high-performing sites in the NorCal study (Paren | Benchmarking DC Fast Charging Station Utilization Against Neighboring Sites)). This corresponds to each charger delivering about 3,946 kWh per day (0.411 × 400 kW × 24 h), or roughly $1,894 in revenue per charger per day at $0.48/kWh. The table below shows the projected earnings at this higher utilization, per charger and for the entire site:
Key Insights and Earning Potential
- Annual Revenue Potential: At 36% utilization, the site could gross on the order of $6.0 million per year in charging fees. At 41.1% utilization, annual revenue rises to about $6.91 million. This shows a substantial earning potential solely from charging activity, even before considering any subsidies or ancillary revenue streams.
- Impact of Utilization: A relatively small increase in utilization (from 36% to 41.1%, ~5 percentage points) yields a significant revenue boost – roughly +$858,000 per year for the site (about a 14% increase in line with the utilization jump). This underscores that charger utilization rate is critical for maximizing revenue. High traffic and efficient use of the stalls (more charging sessions) directly translate to higher earnings.
- Per-Charger vs. Network Scale: Each individual charger at median use generates about $605k/year, and at top-quartile use about $691k/year. With 10 chargers networked at the site, these per-unit revenues aggregate to multi-million dollar figures. This scaling highlights the advantage of deploying multiple chargers: a busy charging hub can capture a large share of energy demand and revenue in a high-EV-adoption area.
- Context – Above-Average Usage Assumed: These scenarios reflect aggressive utilization relative to typical averages. (For context, average DC fast charger utilization in the U.S. is only ~16%, and ~23% in California (Paren | Benchmarking DC Fast Charging Station Utilization Against Neighboring Sites).) The 36% “median” scenario is already well above current averages, representing a strong-performing site (e.g. in a dense EV market with steady demand). The 41.1% scenario is a top-quartile outcome, achievable by the busiest stations in prime locations (Paren | Benchmarking DC Fast Charging Station Utilization Against Neighboring Sites). Investors should recognize that hitting these utilization levels likely requires favorable conditions: high EV traffic, minimal downtime, and possibly time to build a customer base.
- 24/7 Operations and Demand Patterns: We assumed the chargers operate 24/7 with sufficient demand to maintain the target utilization around the clock. In practice, utilization will vary by hour (e.g. peak usage daytime/evenings, lower at night). However, the 36%–41% figures are averages over the full day, and the site’s 24/7 availability allows capturing overnight charging needs as well. Consistent uptime and reliability will be key to reaching these utilization levels.
- Gross Revenue (Before Costs): The revenues shown are gross charging revenues (price × energy dispensed). They do not account for operating costs such as electricity purchase (which includes the utility energy rate, demand charges, etc.), maintenance, or any network fees. For a complete financial picture, those costs (and potential credits like LCFS or incentives) would need to be subtracted to determine net profit. Nonetheless, the figures above give a sense of the earning potential from charging activity alone at this site. For example, even after paying for electricity, a high-utilization station can still be quite profitable – public fast chargers often need around 20% utilization to break even (Are Public EV Chargers Really Underutilized? : r/electricvehicles), so a 36%–41% utilized site would comfortably exceed that threshold.
- Investment Perspective: From an investor’s viewpoint, the Mission Hills location shows strong revenue potential under these utilization scenarios. In a busy EV market, a single fast charger’s ~$600k+ annual revenue can rapidly pay back capital costs (e.g. equipment and installation) and then generate ongoing cash flow. The full site earning ~$6–7 million/year indicates potential for a healthy return on investment, assuming the site achieves and sustains these usage levels. It will be important to support such utilization through strategic site selection (co-locating with amenities/high-traffic areas), reliable equipment uptime, and competitive pricing to attract drivers.
By focusing on these utilization-driven revenue estimates, stakeholders can appreciate how high utilization of EV fast chargers translates into substantial earnings. The Mission Hills site, with 10 high-speed charging stations, stands to capture significant charging demand in the area – providing both a valuable service to EV drivers and a strong revenue stream for the operator.
🚗 Site Quick Facts:
- Location: Prime intersection (I-405, I-5, SR-118), Los Angeles, CA
- Daily Vehicle Traffic: Over 577,000 vehicles pass daily
- EV Share: Estimated 5% EV penetration locally (approx. 28,000–30,000 EVs/day)
- Chargers: 20 stalls, each 400kW DC fast chargers
- Pricing: ~$0.48/kWh (Average session: ~$25)
⚡ Utilization (Charging Demand):
- Expect around 1% of passing EVs (~280 EVs) to stop daily for charging.
- ~14 sessions per charger per day on average (very achievable in high-traffic areas).
- Each charger used roughly 7 hours/day on average, meaning a robust ~30% utilization rate.
🔑 Key Takeaways:
-
These figures represent revenue ONLY from charging sessions—this doesn’t yet factor in additional revenue streams like:
- 🛒 Retail/snack store sales
- 📺 Digital advertising screens
- 🌱 Carbon credits and incentives
-
The location is expected to significantly outperform national utilization averages due to:
- Massive daily traffic exposure (577,000+ vehicles)
- High local EV adoption rate
- Strategic, visible freeway positioning (I-405, I-5, SR-118)
🚀 Investor Community Impact:
EVII Mission Hills is not just an infrastructure project—it’s a scalable, repeatable model for sustainable passive income and value creation. As utilization grows, investors and entrepreneurs involved early will benefit directly through semi-annual dividends.
With EV adoption accelerating fast, now is the ideal moment to be part of a proven, future-forward business.
More info or questions? 👉 evinitiative.network
Sources: Recent utilization benchmarks for DC fast chargers (Northern CA) (Paren | Benchmarking DC Fast Charging Station Utilization Against Neighboring Sites); Typical DC fast charge pricing (Electrify America’s $0.48/kWh in CA) (How Much Does It Cost to Charge an Electric Car? | Edmunds); Profitability threshold utilization ~20% (Are Public EV Chargers Really Underutilized? : r/electricvehicles).
All projections are forward-looking estimates based on the EVII Mission Hills Master Financial Model. They are based on session count and utilization assumptions, not revenue guarantees. The Form C filed with the SEC includes full financial statements, risk factors, and the complete assumptions behind every number.
EVI Infrastructure Inc is not a broker-dealer, funding portal, or investment adviser. All investment opportunities will be offered exclusively through a SEC-registered funding portal or broker-dealer. This website collects expressions of interest only.